Any of the effects that discussed during these lectures (gain, stereo panner, reverb, compressor, equalizer, analyser node for visualization, etc.) may be added to the audio graphs that we have built in our sound sample examples.
Below, we have mixed the code from two previous examples:
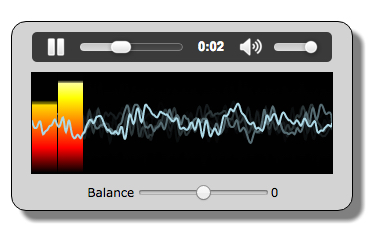
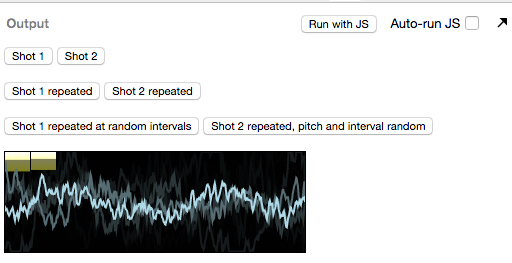
And here is the result (try it at JSBin):
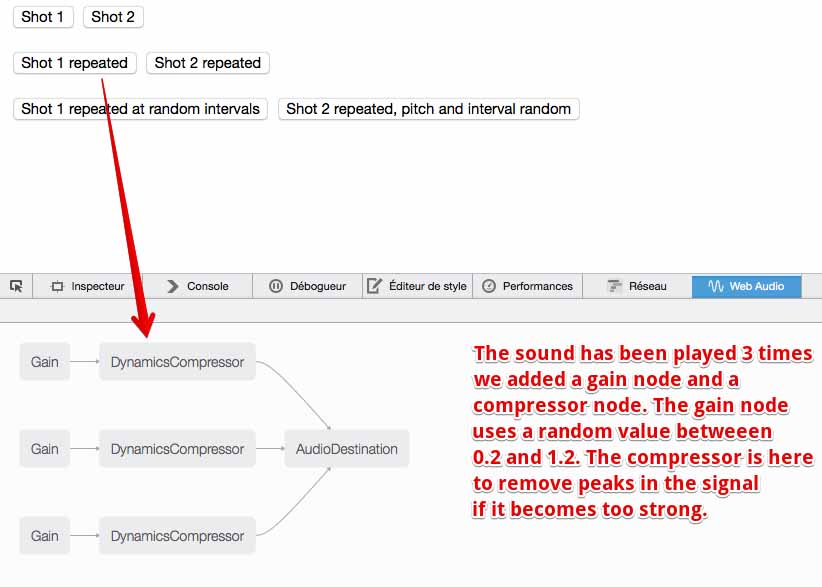
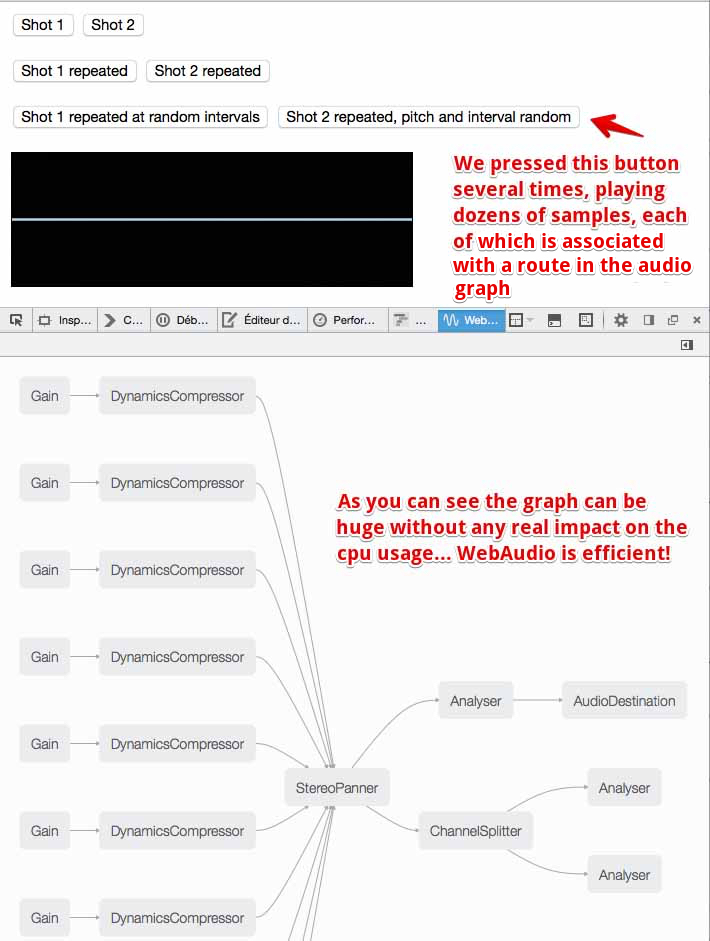
Here is the audio graph of this example:
Look at the source code on JSBin, it’s a quick merge of the two previous examples.
